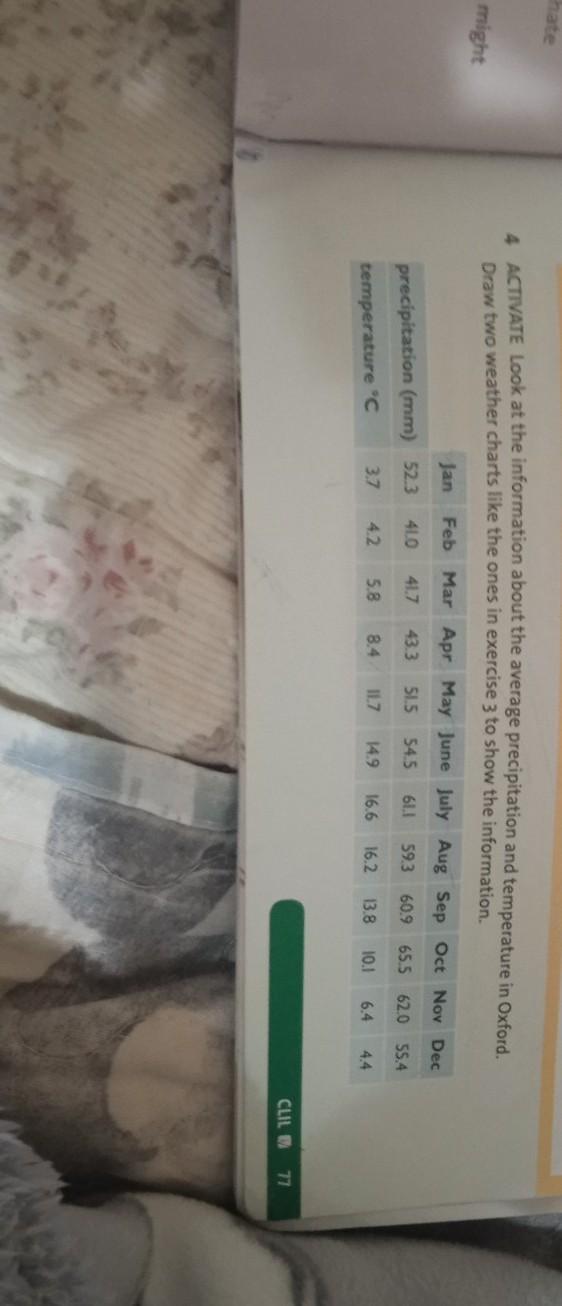
4 ACTIVATE Look at the information about the average precipitation and temperature in Oxford. Draw two weather charts like the ones in exercise 3 to show the information. Jan Feb Mar Apr May June July Aug Sep Oct Nov Dec precipitation (mm) 52.3 4.0 433 525 545 61.1 593 609 65.5 65.5 620 62.0 55.4 temperature C 58 84 117 14.9 16.6 16.2 13.8 10.1 6.4 4.4

Ответ
2
(5 оценок)
8
Ответ:
The warm season lasts for 3.3 months, from June 8 to September 19, with an average daily high temperature above 65°F. The hottest month of the year in Oxford is July, with an average high of 74°F and low of 57°F.
The cold season lasts for 3.4 months, from December 6 to March 18, with an average daily high temperature below 36°F. The coldest month of the year in Oxford is January, with an average low of 13°F and high of 28°F.